Key points
- A 1994 CT study of 115 people found maxillary sinus volumes of 4.56 to 35.21 cm³ in adults over 20 years, with a mean of 14.71 cm³ (standard deviation 6.33 cm³).
- The same study found no significant difference between men and women, while a 2019 CBCT study of 200 patients found larger volumes in males.
- Both studies reported that sinus volume rises until about age 20 and then falls, or falls with each older age group.
- A reported range describes the people and the outlining method of one study, so it is not a cut-off for a single scan.
The best-known range for adult maxillary sinus volume comes from a 1994 CT study of 115 people: 4.56 to 35.21 cm³ in those over 20 years, with a mean of 14.71 cm³.[1] That is a description of one group measured one way. Later CBCT work reports other findings on sex, and the way a sinus is outlined changes the number.
What the 1994 study measured#
The maxillary sinus is the air-filled space inside the upper jaw bone on each side of the nose. In 1994 a research group at Kyushu University in Japan measured it on axial CT slices in 115 cases and related the volume to age, the presence of upper premolar and molar teeth, the size of the midface and body height and weight.[1]
A cubic centimetre is one millilitre (our arithmetic), so the mean is about 15 mL. The largest volume in the adult group was nearly eight times the smallest, and the standard deviation was almost half the mean.[1] A "typical" sinus therefore covers a very wide band of sizes.
Does it differ between sides, sexes and ages?#
The 1994 authors found a close correlation between the right and left sides and no significant sex difference. Volume increased up to the age of 20 years and then decreased. Adult volume correlated with the distance across the cheekbone buttresses. In adult males it also correlated with body height and weight, and in adult females with a skull measurement from the cheekbone to the back of the head. The authors suggest the changes with age may be related to skeletal size and physique.[1]
A 2019 study used CBCT scans from 200 patients at a dental school in Turkey, split into five age groups from 18 to 24 years up to 55 years and older. It also found no significant difference between the right and left sinus. Unlike the 1994 study, it reported volumes significantly higher in males than in females, and a volume that decreased with increasing age.[2] Males aged 18 to 24 years had significantly larger volumes than females of the same age.[2]
| Ariji 1994 | Belgin 2019 | |
|---|---|---|
| Scan type | Axial CT | CBCT |
| People | 115 cases | 200 patients |
| Sex difference | None significant | Higher in males |
| Age | Rose to 20 years, then fell | Fell with older age groups |
| Right versus left | Closely correlated | No significant difference |
Both papers come from single centres in single countries. Their disagreement on sex could come from the people, the scanners or the software, and the abstracts do not settle which.
Why the method changes the number#
Whoever outlines a sinus has to decide where it stops at its opening to the nose and which voxels at its edge count. The two studies above used different tools, and the authors of the 2019 paper note that earlier work has measured sinus volume on cadavers, on flat X-rays, on CT, on MRI and with 3D modelling software.[2]
One 2023 paper compared ways of analysing sinus volume on 190 CBCT scans of Brazilian adults, with volume measured in the ITK software. Whether a sex difference in the right sinus reached statistical significance depended on which analysis method was applied.[3] The paper aimed to build a formula for estimating sex. Here, it shows how the choice of analysis can affect the result.
The same boundary question applies to the airway, and airway volume on CBCT covers it in more detail. The reasons a millimetre or a cubic centimetre on a scan carries some uncertainty are in how accurate CBCT measurements are.
Sinus volume in Jaw Viewer#
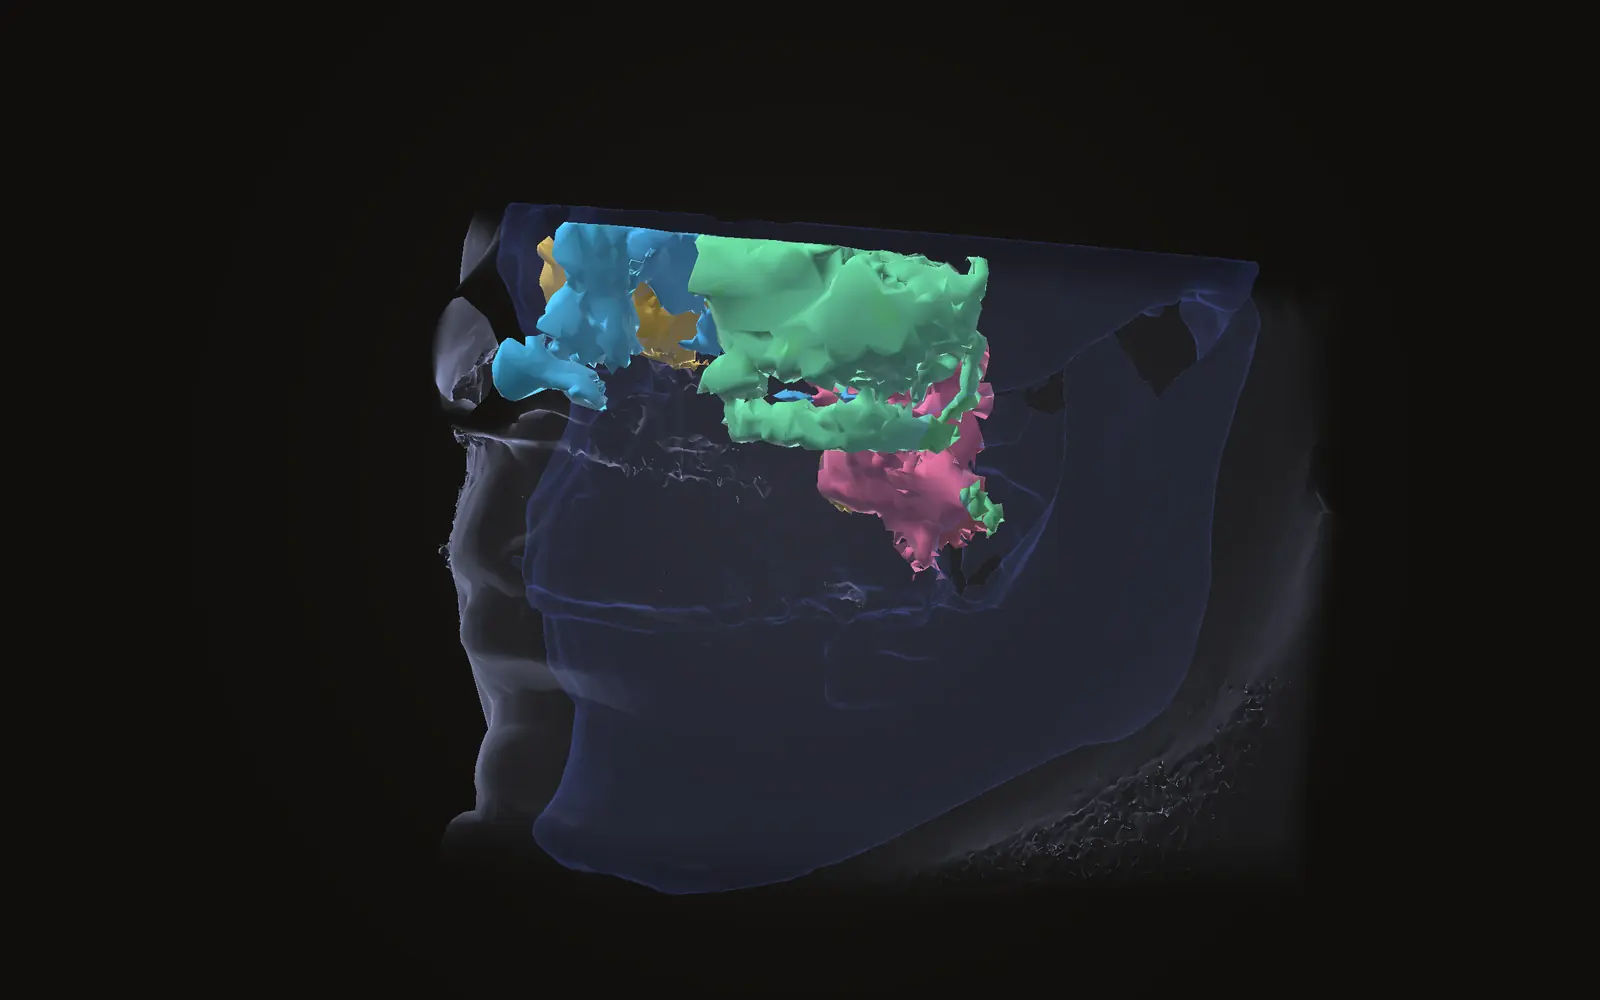
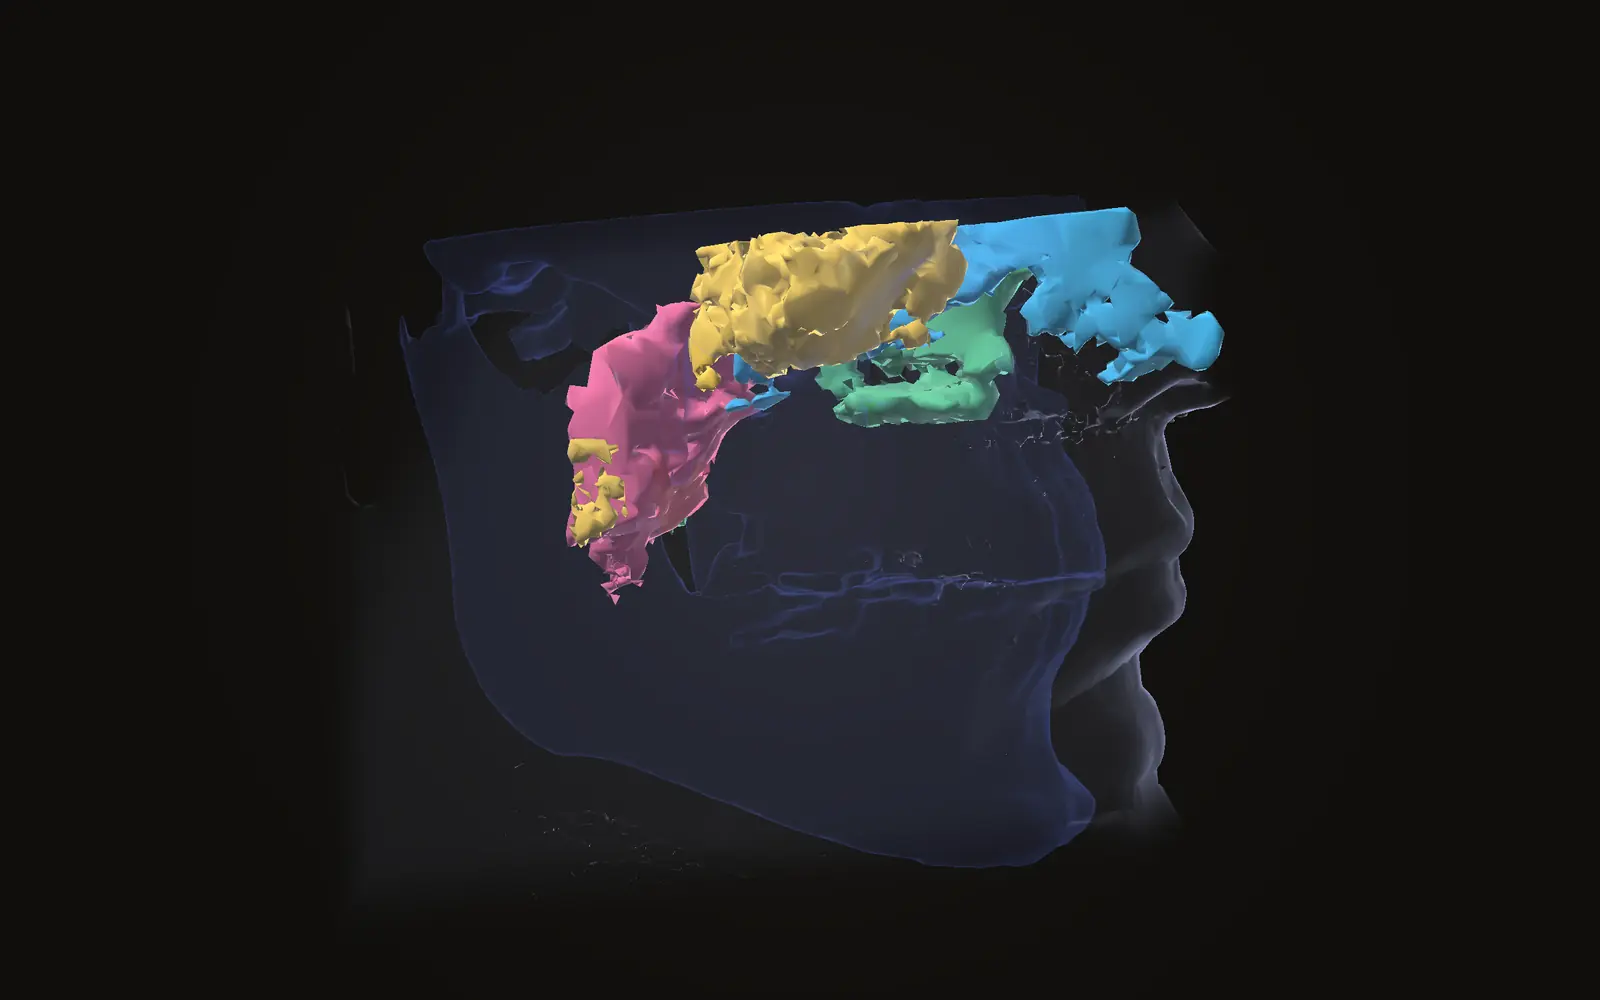
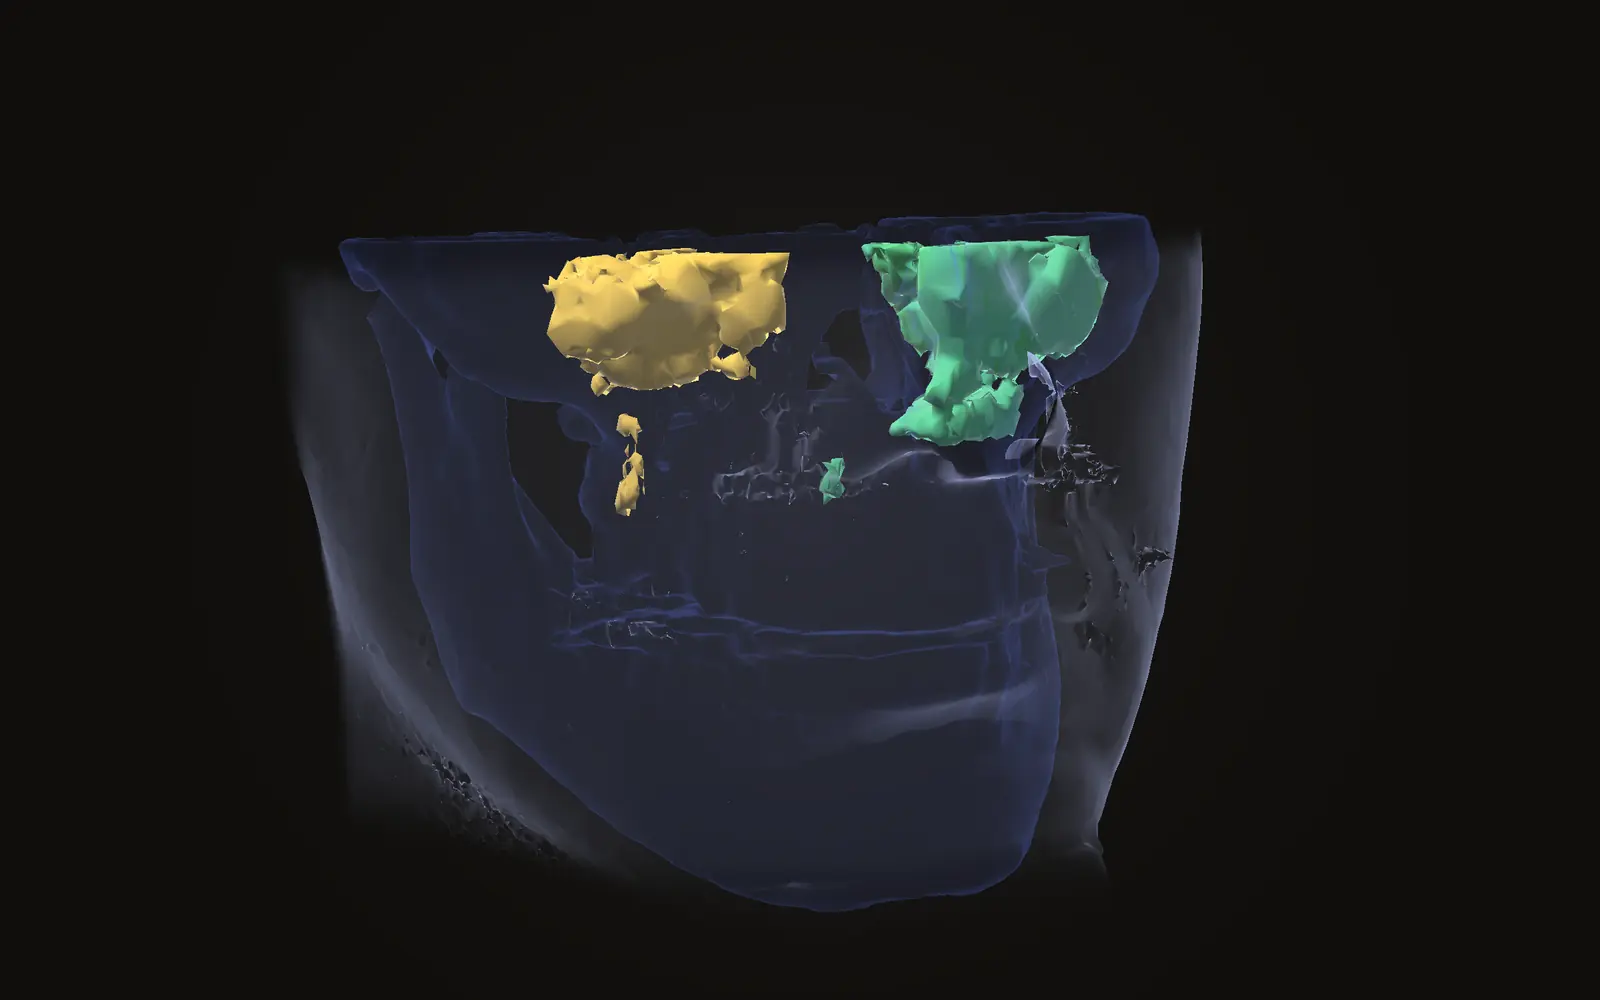
Jaw Viewer can outline the maxillary sinuses and the nasal cavity as separate air spaces and report a volume for each. The airway and sinuses guide walks through the steps. The viewer's own limits page says a volume describes the region the tool selected.
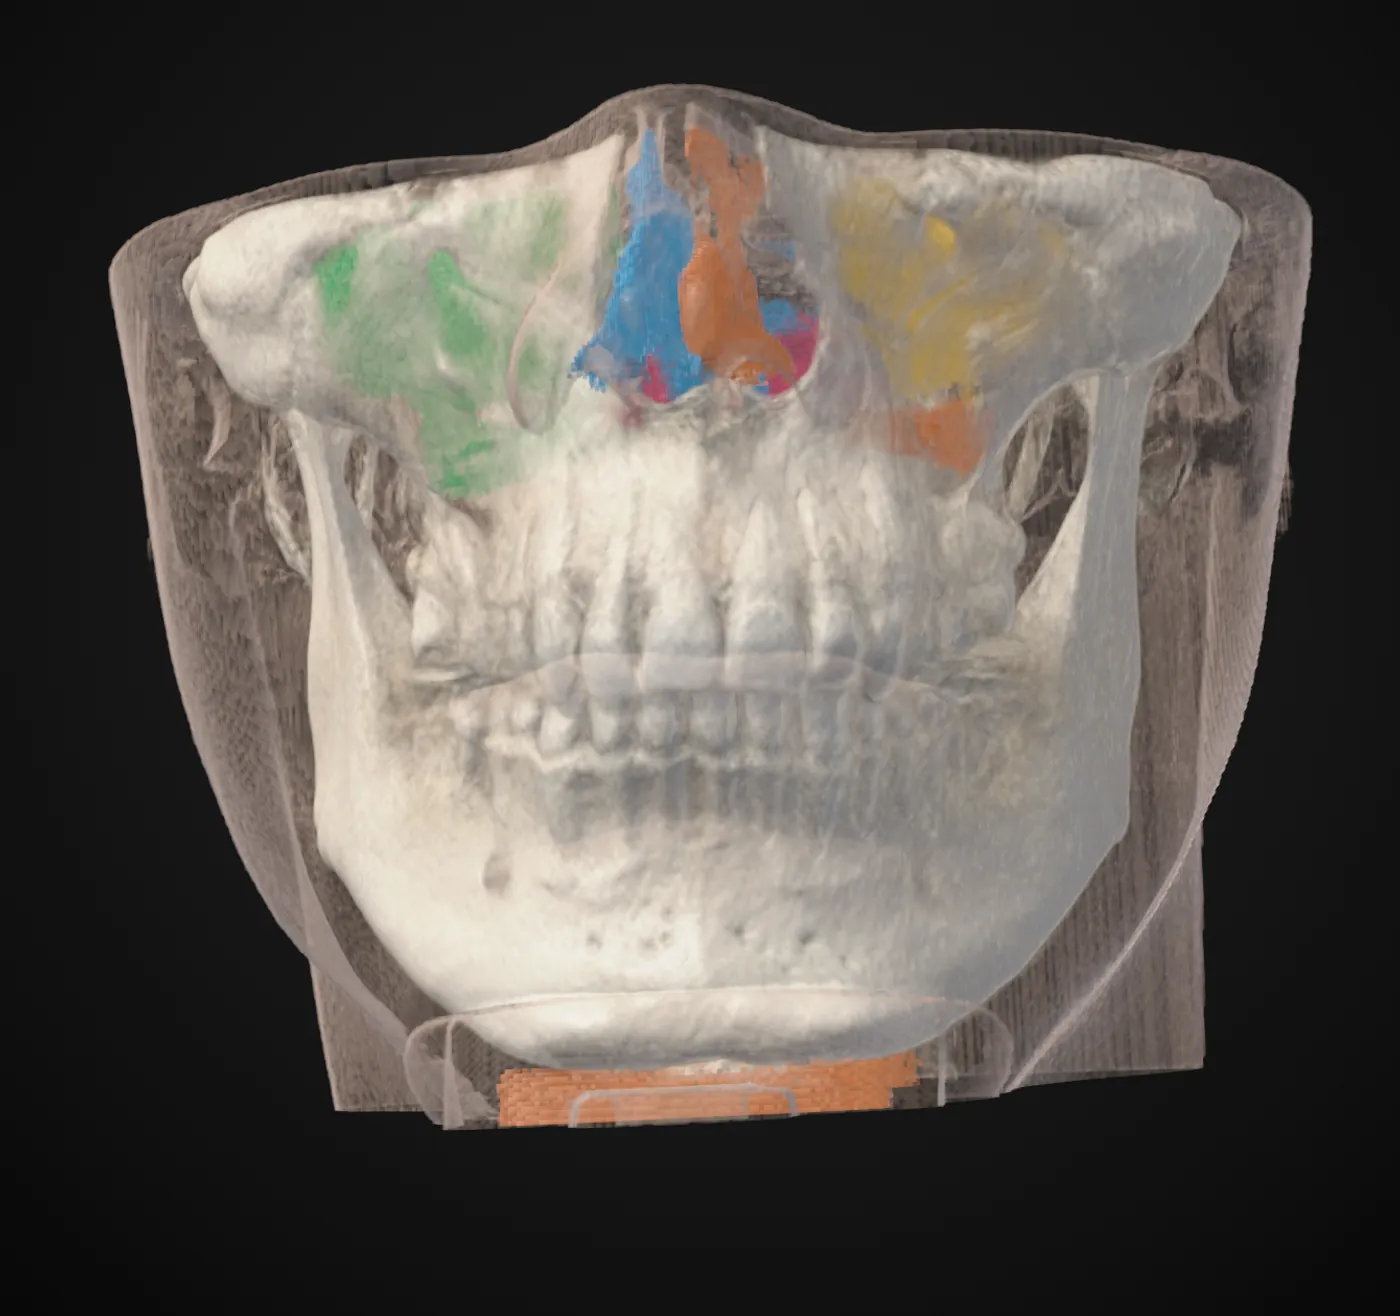
Look at the outline in the slices in all three directions before you read the number. If the colour spills into the nose or stops short of the sinus floor, the volume describes that outline. The size of each voxel also limits how closely an outline can follow a thin wall, which CBCT voxel size and sharpness explains. What a scan can and cannot show more generally is in what a CBCT scan shows.
What is the average volume of the maxillary sinus?
In a 1994 CT study of 115 people, adults over 20 years averaged 14.71 cm³, with a spread of 4.56 to 35.21 cm³. That describes one group and one method, not a value for any single person.
Do men and women have different maxillary sinus volumes?
Studies disagree. The 1994 CT study found no significant sex difference. A 2019 CBCT study of 200 patients found volumes significantly higher in males than in females.
Does maxillary sinus volume change with age?
Both studies say yes. The 1994 study found volume rose up to about age 20 and then decreased. The 2019 study found it decreased as age groups got older.
Is a sinus volume outside the published range a sign of a problem?
A published range cannot answer that. It describes the people and method of one study, and the spread was wide. A clinician reading your scan can say what matters for you.
Sources
- Ariji Y, Kuroki T, Moriguchi S, et al. (1994). Age changes in the volume of the human maxillary sinus: a study using computed tomography. Dentomaxillofac Radiol, 23: 163-8. Axial CT of 115 cases at a university hospital in Japan; the one study here that reports a numeric range.DOIPubMed
- Aktuna Belgin C, Colak M, Adiguzel O, et al. (2019). Three-dimensional evaluation of maxillary sinus volume in different age and sex groups using CBCT. Eur Arch Otorhinolaryngol, 276: 1493-1499. 200 CBCT scans from one dental school in Turkey in five age groups; the abstract gives the direction of the findings, not volumes.DOIPubMed
- Camarini C, Teixeira LCL, Takeshita WM, et al. (2023). Comparison of different methods of analysis of maxillary sinus volume and validation of a new proposal using cone beam computed tomography. J Forensic Leg Med, 100: 102611. 190 CBCT scans of Brazilian adults. The aim was sex estimation, which this article does not use; cited only for how the analysis method affected the comparison.DOIPubMed
Terms used
- Maxillary sinus
- The air-filled space inside the upper jaw bone on each side of the nose, above the upper back teeth and below the eye socket.
This is general information, not medical advice. Jaw Viewer is not a medical device. Talk to your surgeon, orthodontist or radiologist about your own case.